
TL;DR
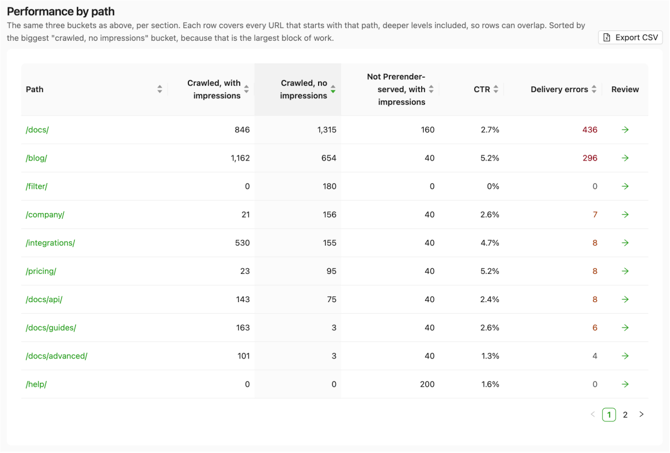
Performance by path is a section-level view of your site, grouped by first-level URL path like /docs/, /blog/, or /property/. Each row rolls the same three coverage groups from your KPI cards up per section, so you can spot the parts of your site with the biggest gap between what Prerender served and what Google recorded impressions for. The default sort surfaces the highest-priority sections first, and selecting Review on any row drills into the individual URLs.
Why Performance by path matters
A flat list of thousands of URLs doesn't tell you where to start. Performance by path answers a more useful question: which section of my site needs attention? By rolling every URL up to its first path segment, it turns URL-level noise into a short list of sections you can prioritize — your blog, your docs, your product pages — and shows you the gaps in each.
How does Performance by path group URLs?
Each row represents a first-level path — the first segment of the URL after your domain:
example.com/docs/api/setup→ rolls into/docs/example.com/blog/2026/hello-world→ rolls into/blog/example.com/property/london/kensington→ rolls into/property/
Rows don't overlap. Every URL rolls into exactly one first-level path. There's no separate /docs/api/ or /docs/api/setup/ row — deeper paths roll all the way up to the first segment. This matches how you probably think about your site structure already: your blog, your documentation, your product pages, your marketing pages.
What do the Performance by path columns mean?
For every first-level path in the table:
- Path — the first-level path, like
/docs/. - Crawled, with impressions — count of URLs in this section that Prerender served and Google recorded impressions for.
- Crawled, no impressions — count of URLs in this section that Prerender served with no impressions recorded.
- Not Prerender-served, with impressions — count of URLs in this section that Google recorded impressions for, but Prerender didn't serve.
- CTR — total clicks divided by total impressions for the Google Search Console URLs in this section. Shows a dash (
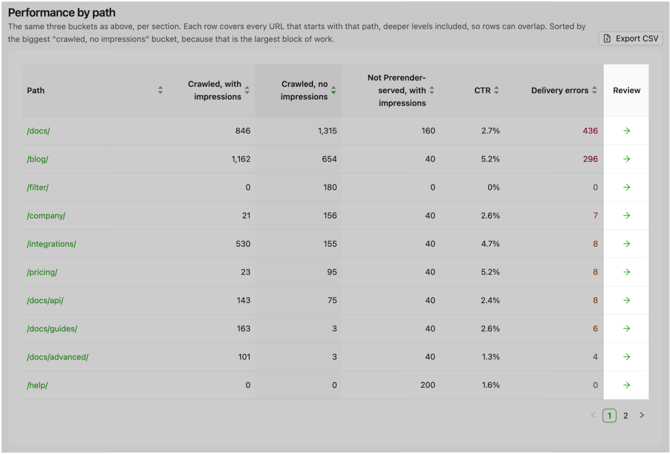
—) if impressions are zero. - Delivery errors — count of URLs in this section that Prerender served with a non-200 HTTP status. Color-coded so sections with problems stand out.
- Review — a link that opens the Pages tab filtered to that path.
The three coverage-group counts use the same definitions as the KPI cards. See What do the Search Performance KPI cards show? for the full definitions.
How are rows sorted by default?
Rows sort by Crawled, no impressions descending. The sections with the largest gap between "Prerender served it" and "Google recorded impressions for it" come first — usually the highest-signal place to start a review. You can sort by any column by selecting its header.
How should I use Performance by path?
Two typical workflows:
1. "Which section of my site should I look at?"
Start with the default view — Crawled, no impressions descending. The top rows are sections where Prerender is doing work, serving pages to Googlebot, but those pages aren't showing impressions. That gap is worth understanding.
2. "This section is bigger than expected in one group."
Sort by the group you care about. For example, sort Not Prerender-served, with impressions descending to find sections where a lot of impressions are happening on pages Prerender isn't serving. Then select Review to drill into the individual URLs.
How do I drill into a section?
Selecting Review on any row opens the Pages tab, filtered to that first-level path. Your domain selection and reporting period carry over. From there you can see individual URLs, sort them, filter further, and investigate.
What are delivery errors and why do they matter?
The Delivery errors column shows how many URLs in a section Prerender served with a non-200 HTTP status. These are pages where something went wrong when Googlebot requested them.
The column is color-coded so sections with a high count stand out. Fixing delivery errors is usually the highest-impact fix — it makes sure Googlebot actually gets a working page. To see the individual URLs with errors in a section, select Review on that row, then open the Delivery errors tab in Pages.
What if Performance by path is empty?
If there are no rows to show — for example, when you have no Prerender-served URLs yet — you'll see an empty state message instead of an empty table.
Try it out
Ready to see which parts of your site need attention? Log in to your Prerender dashboard and open Search Performance to view Performance by path for your connected domains. If you haven't connected Google Search Console yet, head to the Integrations page to get started.
Related articles
- What do the Search Performance KPI cards show?
- Understanding the Pages tab in Search Performance
- Understanding Search Performance in your Prerender dashboard
💬 Still need help?
If you have questions about Performance by path or how to prioritize sections, our support team can help.
→ Contact us at support@prerender.io