TL;DR
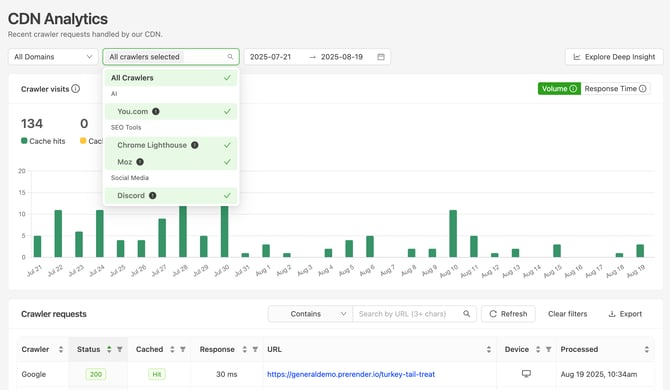
CDN Analytics in your Prerender.io dashboard shows you which crawlers are visiting your site, whether they are getting cached pages (hits) or triggering fresh renders (misses), and what HTTP status codes they receive. You can filter by domain, crawler, and date range, drill into individual URLs, and export charts to PDF.
If you notice a difference between the render counter and dashboard values, this is most likely due to a timezone mismatch rather than an error in the actual render count.
Why this matters
Understanding how crawlers interact with your site helps you identify issues before they affect your AI & Search visibility. High cache miss rates mean slower responses to crawlers. Unexpected status codes (404s, 503s) mean crawlers are finding problems. CDN Analytics gives you the data to catch and fix these issues.
Key features
- Crawler activity breakdown. See visits by individual crawlers (Googlebot, GPTBot, ClaudeBot, BingBot, and others), grouped by category (AI, SEO Tools, Social Media). Filter by specific crawlers or view all at once.
- Cache performance. Track cache hit and miss ratios and delivery times to understand how your pages are being served to crawlers.
- Status codes. Monitor 2xx, 3xx, 4xx, and 5xx responses. Drill into problem codes (like 404s or 503s) to find affected URLs.
- Pages crawled and rendered. Compare crawler requests and whether they resulted in a cache hit or miss. Monitor rendering volume over time.
- Filters and sorting. Drill down into your data to understand which crawlers are visiting your site and how.
- Export. Download the data currently displayed in the table using the Export button.
Filters, sorting, and exports
To filter by specific pages or URLs, use the text box at the top of the table area. To drill deeper into a specific column, click the small filter icon next to the column title. To change sorting, click the up/down arrows on any column header.
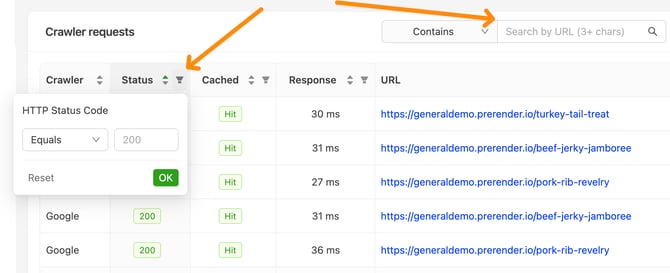
To export the data currently displayed, click the Export button. Any active filters are automatically applied to your export.
Export charts to PDF
You can export CDN Analytics charts to PDF, making it easy to share performance data within your organization or with clients. This feature is available to all users regardless of plan.
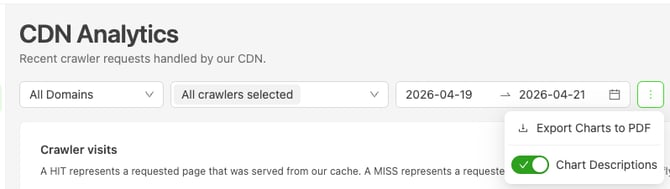
To export, click the three-dot menu in the top-right corner of the CDN Analytics page and select Export Charts to PDF.
Export Charts to PDF
You can export CDN Analytics charts to PDF, making it easy to share performance data within your organization or with your clients. This feature is available to all users regardless of the plan.
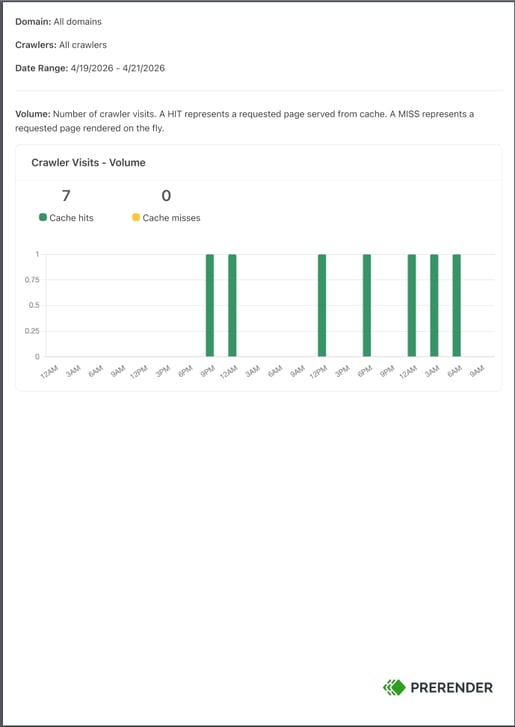
The exported PDF includes your selected domain, crawler filters, date range, and chart descriptions with the Prerender.io branding.
Important notes
- Tables show real-time data, charts use aggregated data. Small variations between tables and charts are expected.
- The crawler filter updates every hour. You may see a crawler in the table before it appears in the filter dropdown.
- Missing crawlers? If you do not see all crawlers shown in the screenshots, ensure Prerender.io is serving data to as many crawlers as possible. See How do I add AI crawlers and bots to my integration? to configure additional bots.
- Full crawler strings. Hover over a crawler name in the Crawler column to see the full user-agent string. The full string is also included as a separate column in exported files.
Related articles
- How cache expiration works in Prerender.io
- How do I cache specific URLs?
- How do I use the Prerender recache script to refresh multiple URLs?
💬 Still need help? If you have questions about your CDN Analytics data, crawler activity, or cache performance, our support team can help. → Contact us at support@prerender.io